> ## Documentation Index
> Fetch the complete documentation index at: https://help.kajabi.com/llms.txt
> Use this file to discover all available pages before exploring further.
# Report: New subscriptions over time
> Track new subscription counts and gross revenue over time.
Displays new subscription counts and gross revenue over time, tracking all completed subscription purchases including those with a trial. Purchase counts are based on the original transaction date, regardless of any trial period. Gross revenue reflects the setup fee amount when applicable, with \$0 recorded for trial-only purchases without a setup fee.
This report is most useful for:
* Comparing periods of growth to identify seasonality, promotional performance, or shifts in customer subscription purchase behavior
## Data presented in this report
 ### Visual charts
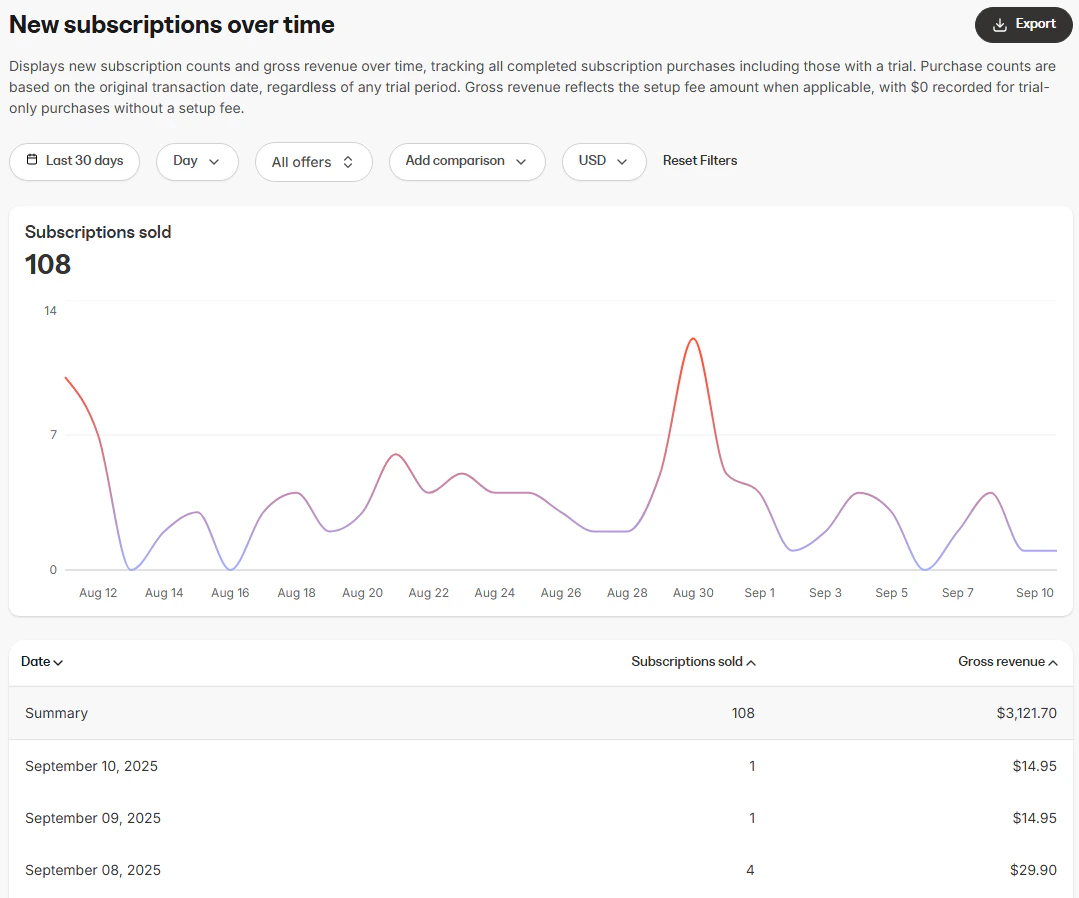
* **Subscriptions sold (line chart)**: Shows the total count of new subscriptions purchased within the selected time frame
### Data table
The data table below the chart provides a daily breakdown, including:
* **Interval**: The specific interval period (day, week, month, or year) across the time range selected
* **Subscriptions sold**: The number of new subscriptions purchased. Purchase counts are based on the original transaction date, regardless of any trial period
* **Gross revenue**: The total gross revenue earned from purchased subscriptions. Gross revenue reflects the setup fee amount when applicable, with \$0 recorded for trial-only purchases without a setup fee
## How to use the report
### Controls
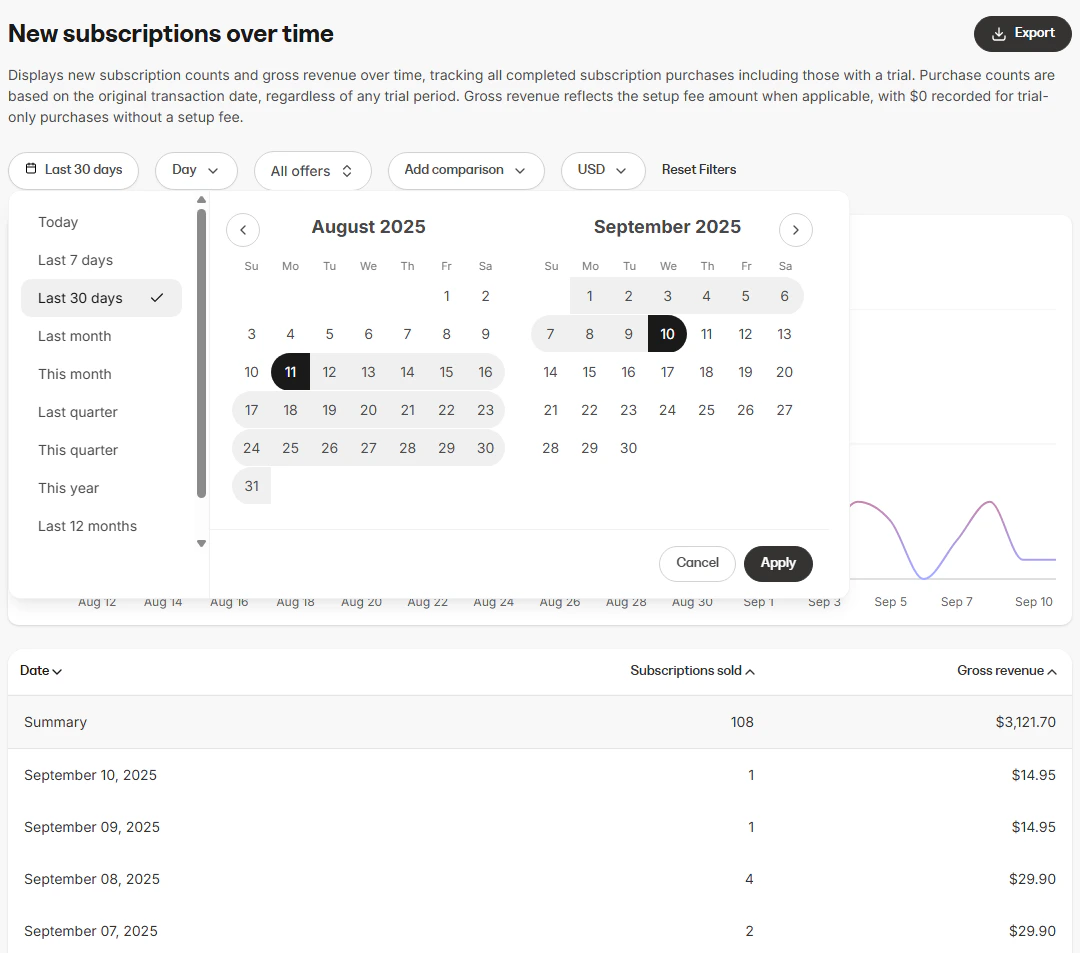
* **Time range**: Filter payments by period (e.g., last 7 days, last 30 days, custom date range)
* **Interval**: Choose how the data is grouped within the selected time range (Day, Week, Month, Year)
* **Offer selection**: Choose whether to view data for multiple offers or a specific offer
* **Comparison**: Use the **Add comparison** option to compare current subscription performance to a past period. This helps identify growth trends or seasonal changes
* **Currency selector**: View stats in your preferred currency
### Visual charts
* **Subscriptions sold (line chart)**: Shows the total count of new subscriptions purchased within the selected time frame
### Data table
The data table below the chart provides a daily breakdown, including:
* **Interval**: The specific interval period (day, week, month, or year) across the time range selected
* **Subscriptions sold**: The number of new subscriptions purchased. Purchase counts are based on the original transaction date, regardless of any trial period
* **Gross revenue**: The total gross revenue earned from purchased subscriptions. Gross revenue reflects the setup fee amount when applicable, with \$0 recorded for trial-only purchases without a setup fee
## How to use the report
### Controls
* **Time range**: Filter payments by period (e.g., last 7 days, last 30 days, custom date range)
* **Interval**: Choose how the data is grouped within the selected time range (Day, Week, Month, Year)
* **Offer selection**: Choose whether to view data for multiple offers or a specific offer
* **Comparison**: Use the **Add comparison** option to compare current subscription performance to a past period. This helps identify growth trends or seasonal changes
* **Currency selector**: View stats in your preferred currency
 ## Export information
When you export the **New subscriptions over time** report, the resulting file will include the same columns and reflect any filters you have applied. This ensures the data in the export matches what is displayed in the report:
* Date
* Subscriptions sold
* Gross revenue
* Currency
## Export information
When you export the **New subscriptions over time** report, the resulting file will include the same columns and reflect any filters you have applied. This ensures the data in the export matches what is displayed in the report:
* Date
* Subscriptions sold
* Gross revenue
* Currency