The Dashboard is your home base — the first screen you see each time you log into your Kajabi account. From here, you can view a brief overview of your analytics, customize the metrics on display, and access additional resources.
After creating your Kajabi Account, learn the basics of Kajabi by completing the checklist directly below your Metrics.
Want to refer back to your checklist later? Simply navigate back to your Dashboard by clicking on the Kajabi logo in the top left corner.
Tip:
Keep an eye on your Dashboard’s sidebar for announcements such as updates, scheduled maintenance, and more.
Customize metrics
The data displayed on your dashboard can be filtered by date. Use the drop-down range menu to view the last 30 days, last 7 days, or the last 24 hours of stats.
 Want to view different metrics on your dashboard? You can customize which 4 metrics you want to view on your dashboard at all times.
To customize your dashboard metrics:
Want to view different metrics on your dashboard? You can customize which 4 metrics you want to view on your dashboard at all times.
To customize your dashboard metrics:
- From your dashboard, click the Customize metrics button.
- You can display up to four metrics at a time. If you have selected four and want to add a new one, you must unselect an existing metric before activating a new metric.
- Choose which four metrics you wish to be displayed on your dashboard.
- Click Save metrics to save your changes.
For more information about these metrics, refer to the Analytics Reports article.
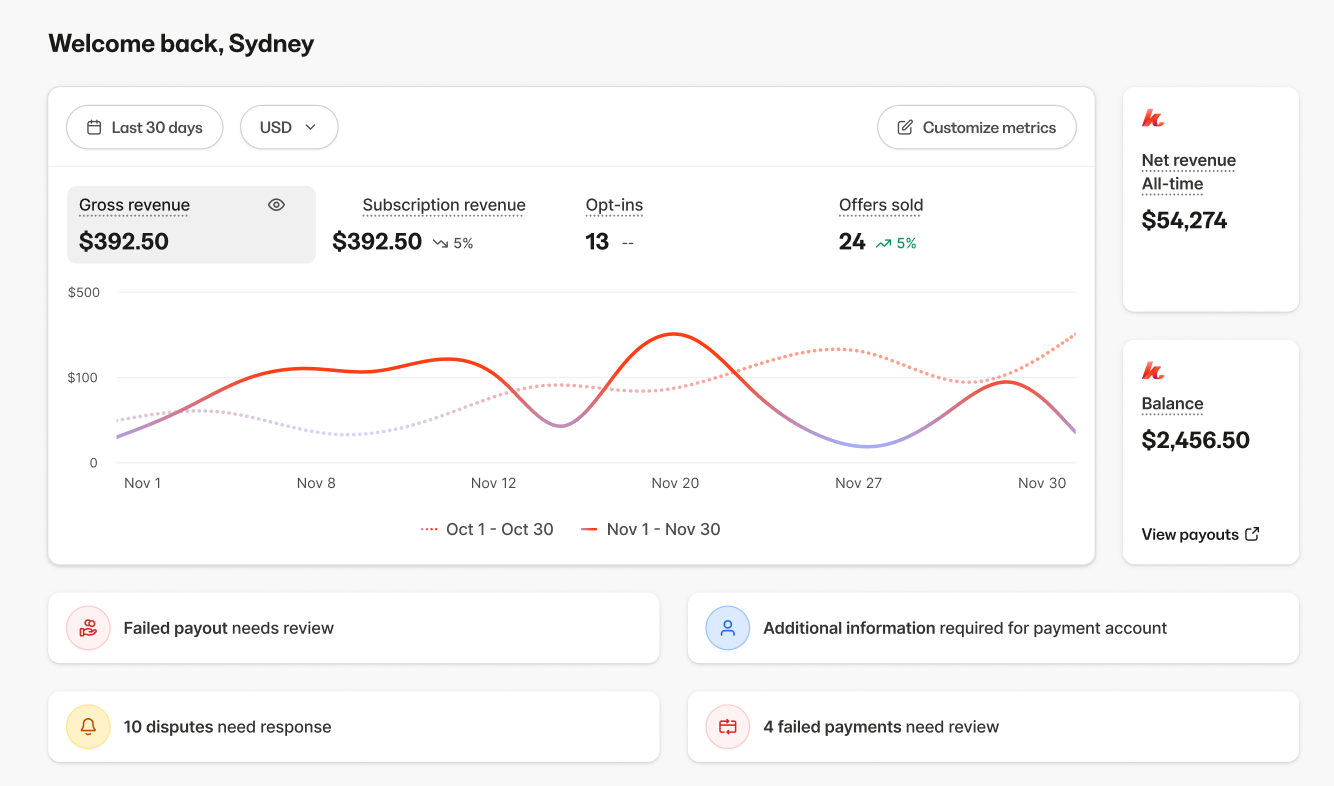
Dashboard alerts
Stay on top of important account issues with these key alerts that may appear on your Kajabi dashboard homepage to notify you of payment-related matters requiring your attention:
- Failed Payout Needing Review - Your payout failed and requires your attention to resolve the issue and ensure you receive your earnings.
- Additional Information Required for Payment Account - Your Kajabi Payments account needs updated or additional information to continue processing transactions smoothly.
- Disputes Requiring Response - Customers have disputed charges, and immediate action is needed to respond to and resolve payment disputes.
- Failed Payments Needing Review - This shows the count of customer payments that have failed within the last 30 days and need your review.
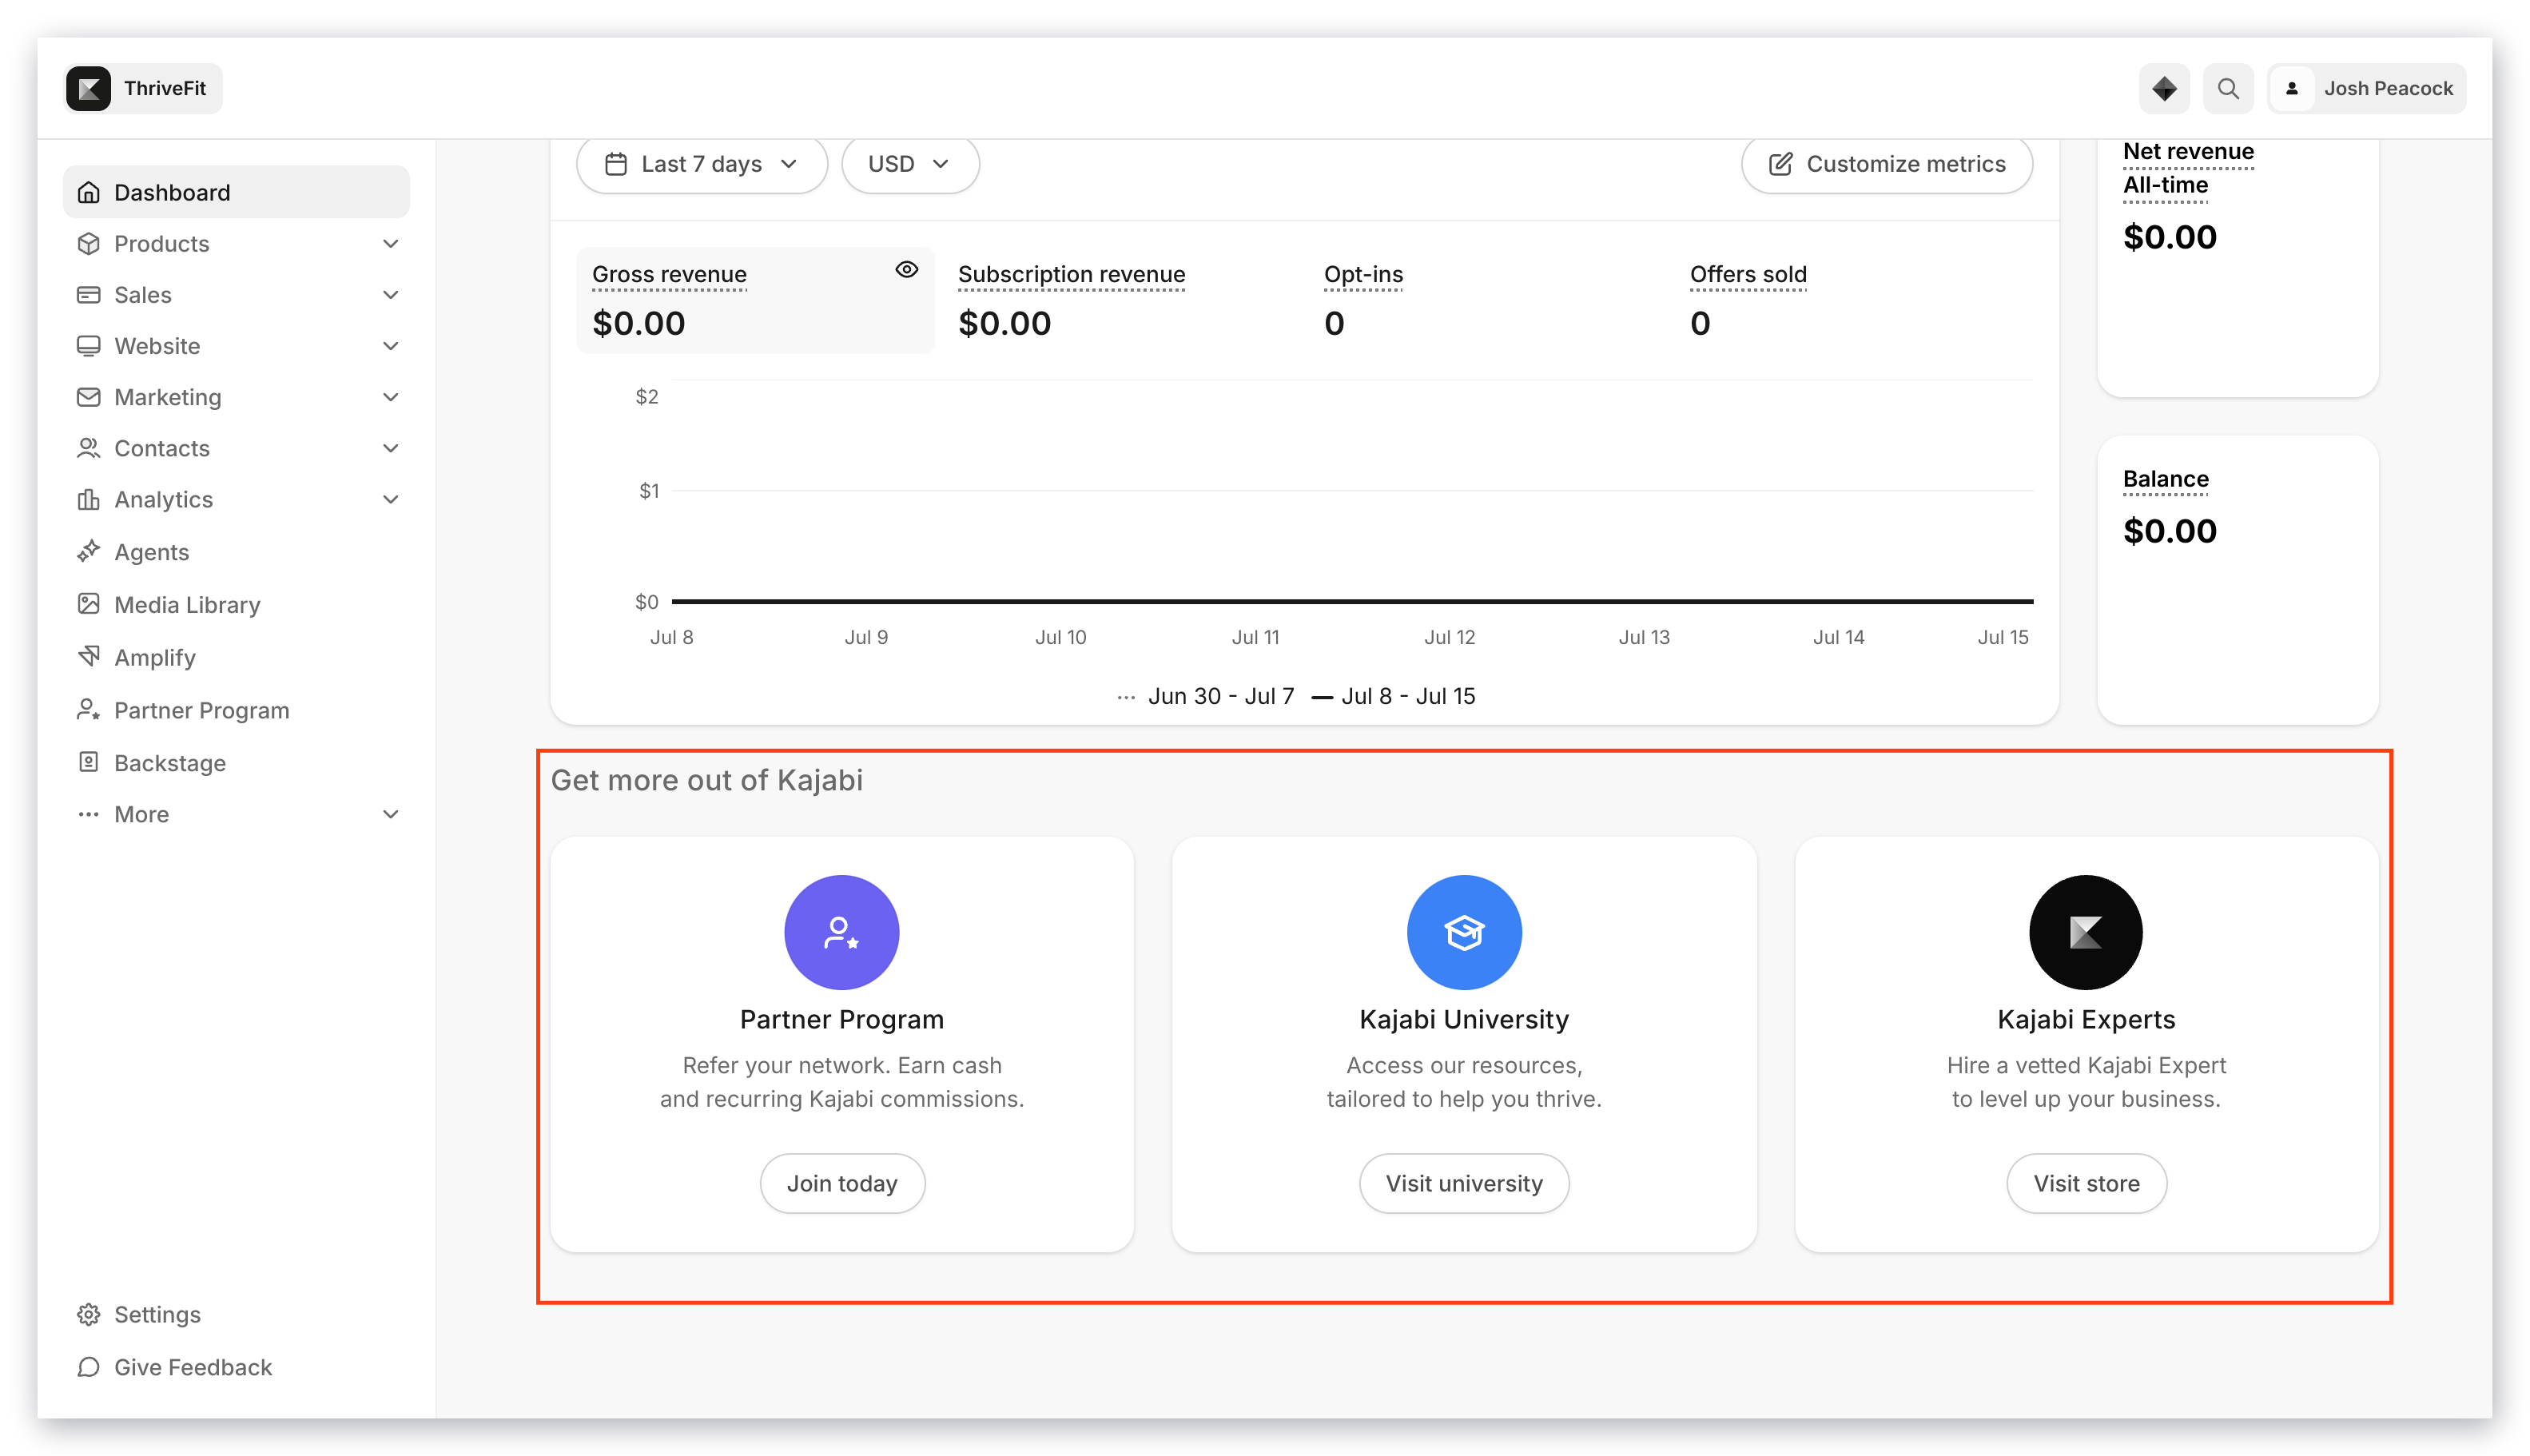
Additional resources
Below your Metrics, you can access additional resources and view the latest product updates to learn how to use Kajabi to accomplish your vision for your business.
View additional resources under the Get more out of Kajabi heading to join the Kajabi Community, access Kajabi University, or check out Kajabi Experts.