
The Subscription Metrics Report tracks data related to subscription-based products over a given time period. Learn about MRR, ARPU, and Churn and how to read the Subscription Metrics Report to keep track of your subscription-based products!
In this article:
How to view your subscription metrics reports
To view your report:
Open the Analytics tab from your Dashboard.
Click View in the Subscription Metrics card:
Monthly Recurring Revenue (MRR)

What is MRR and who is it important to?
MRR, or Monthly Recurring Revenue, is all of your recurring revenue normalized into a monthly amount.
This report is vital for subscription businesses because revenue and profits trickle in over time. So, it's important to measure growth and revenue in a similar way. MRR provides an easy way to forecast future cash flows.
How to calculate MRR?
The best way to calculate MRR is to obtain the average monthly subscription, multiplied by the number of subscription payments, minus any subscription discounts.
MRR = All subscriptions * ((monthly average subscription * number of subscription payments) - subscription discounts))
OR
MRR = Total Monthly Subscription Revenue - Monthly Discounts
For instance, if you have Customer A paying $150/monthly and Customer B paying $200/monthly, your MRR would be $350.
Average Revenue Per User (ARPU)
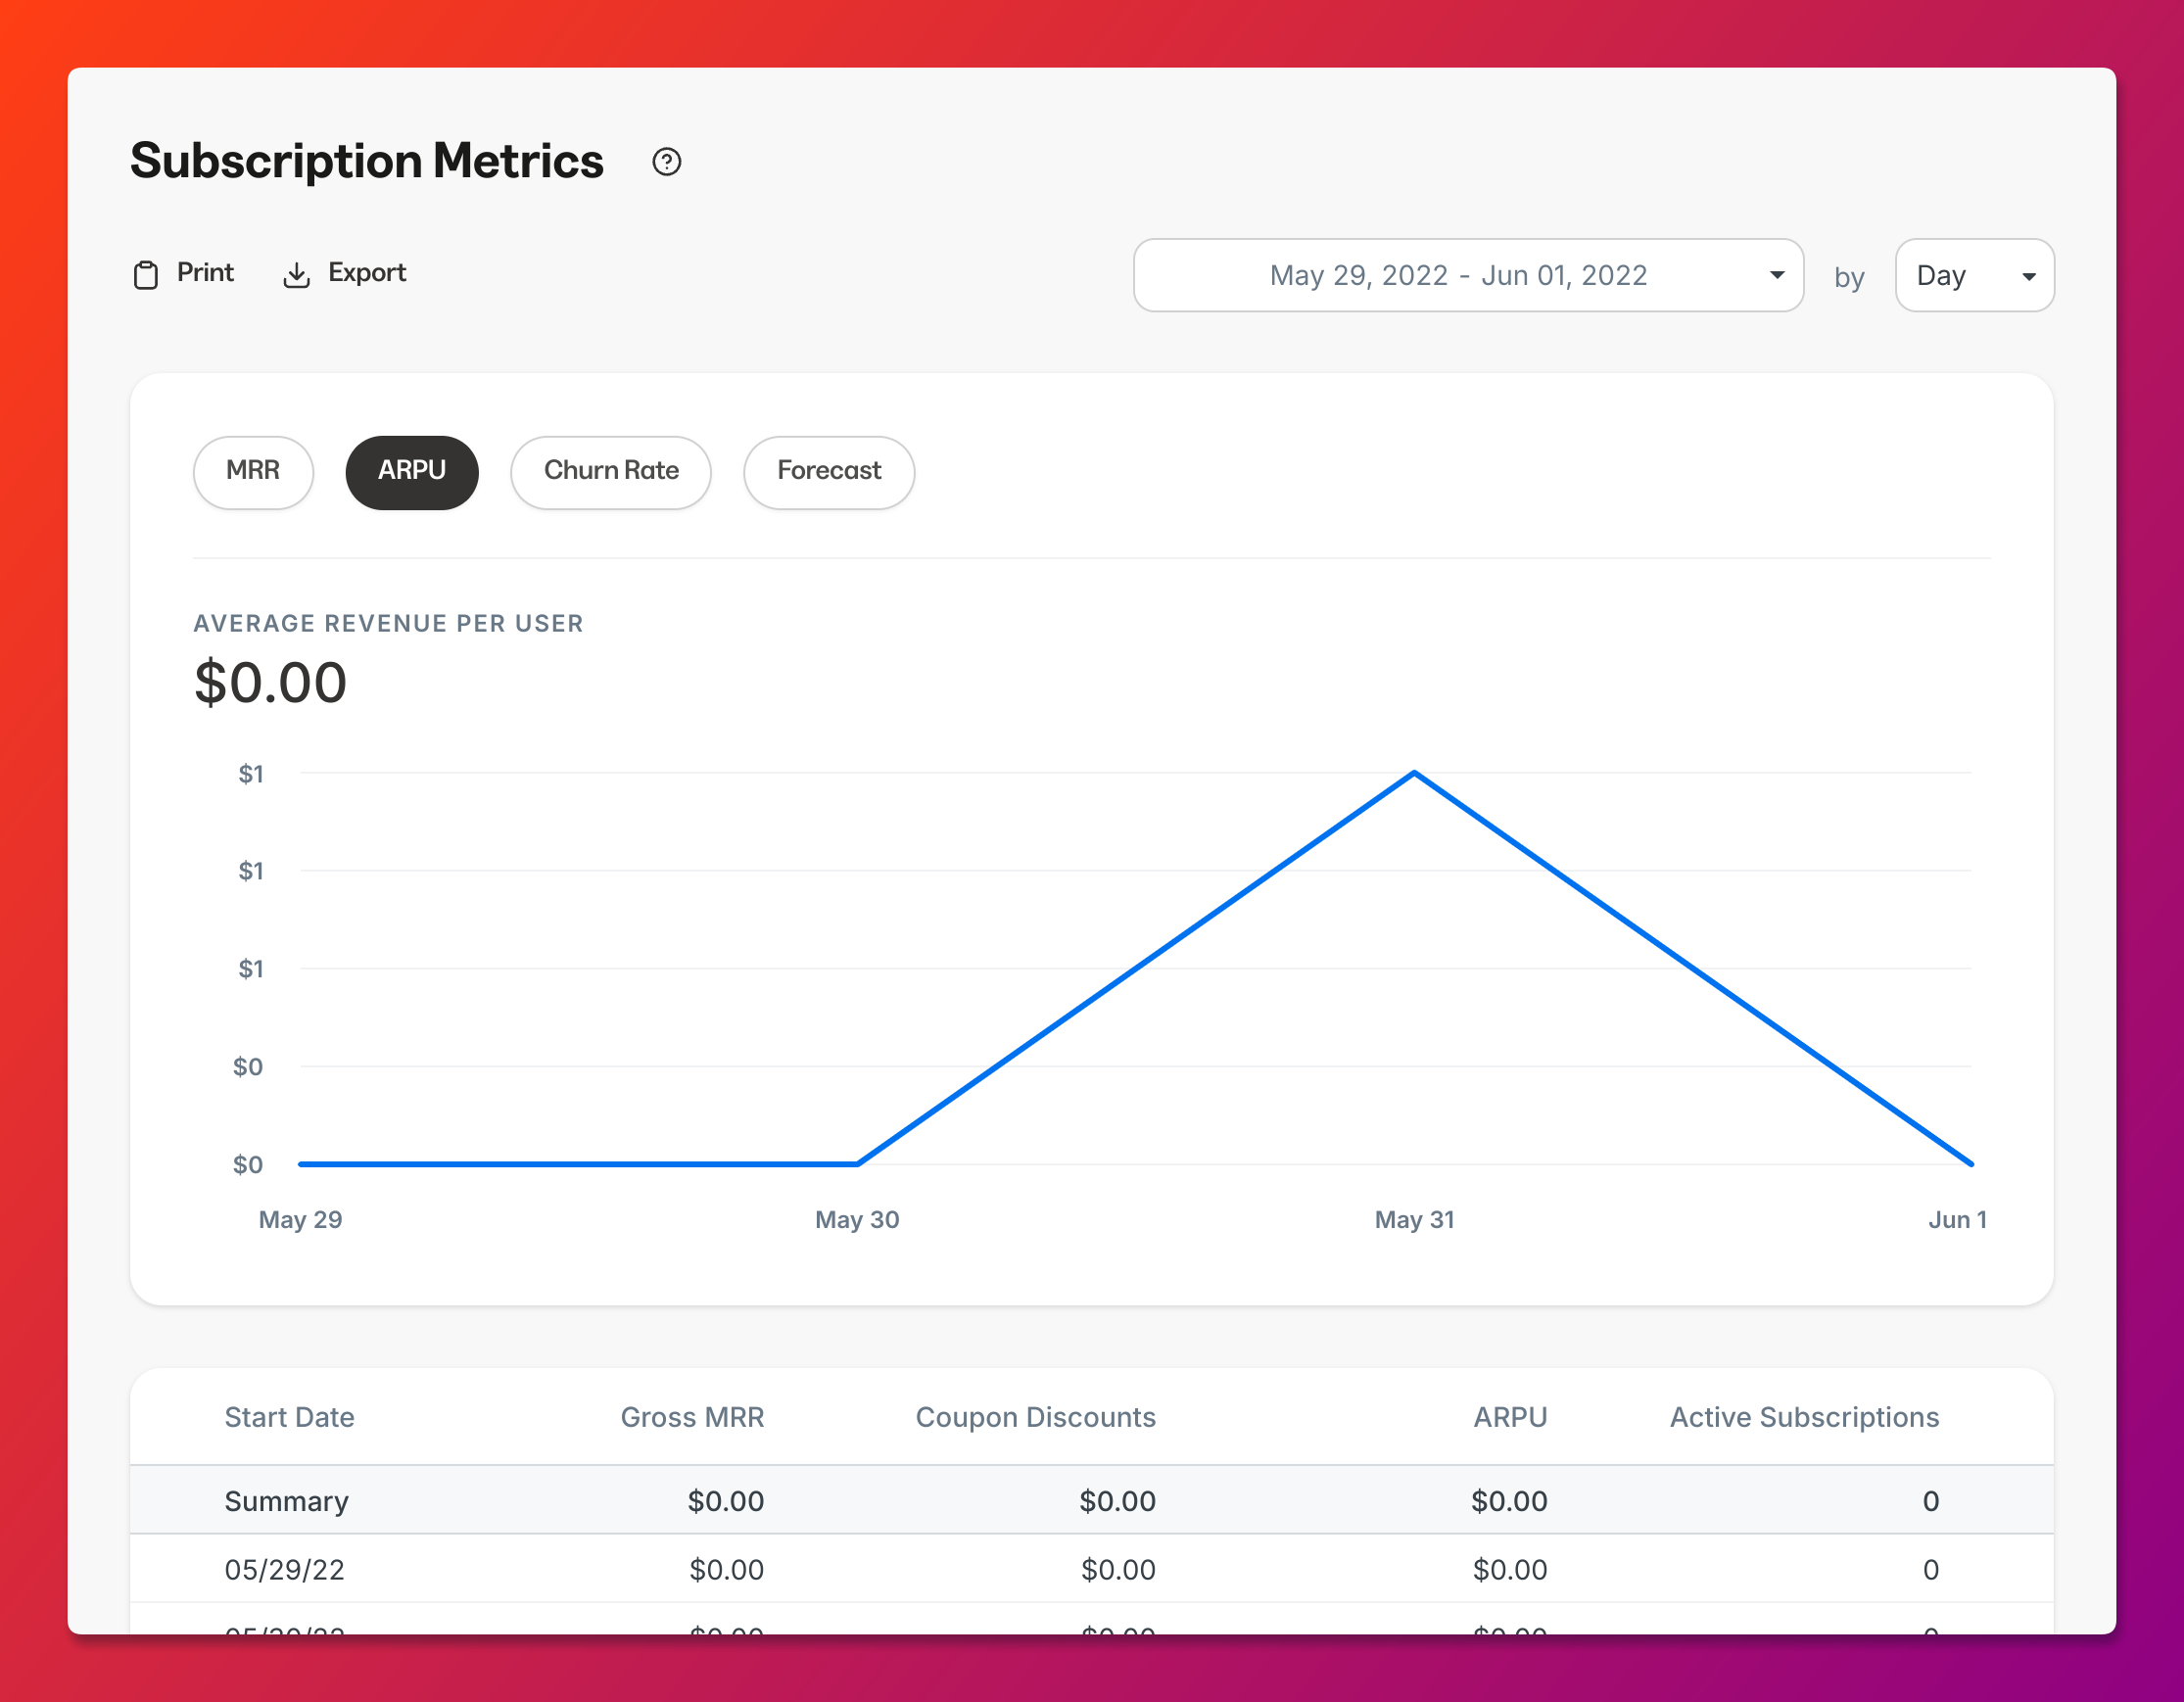
What is ARPU?
ARPU, or Average Revenue Per User, is especially useful if you have a business with multiple tiers of subscriptions.
Let's say you have a 3-tiered subscription model with plans at $10, $50, and $80. Understanding ARPU can help you make pricing decisions and understand whether your type of customer skews toward higher or lower pricing plans.
Tip:
If you recently increased your prices, compare date ranges in ARPU to see if your ARPU has gone up.
How is ARPU calculated?
ARPU = MRR / Active Customers
Strategies to increase and optimize ARPU?
Have a clear add-on or upgrade strategy
Focus on retention
Churn

What is Churn?
Churn is a business metric that calculates the number of customers who leave a business or stop paying over a given period of time. Customer churn is important to understand the health and retention of your business.
Churn Rate Formula
The Churn Rate Formula can be calculated as the number of churned customers divided by the total number of customers:
Churn rate = (number of churned customers / total number of customers) 100
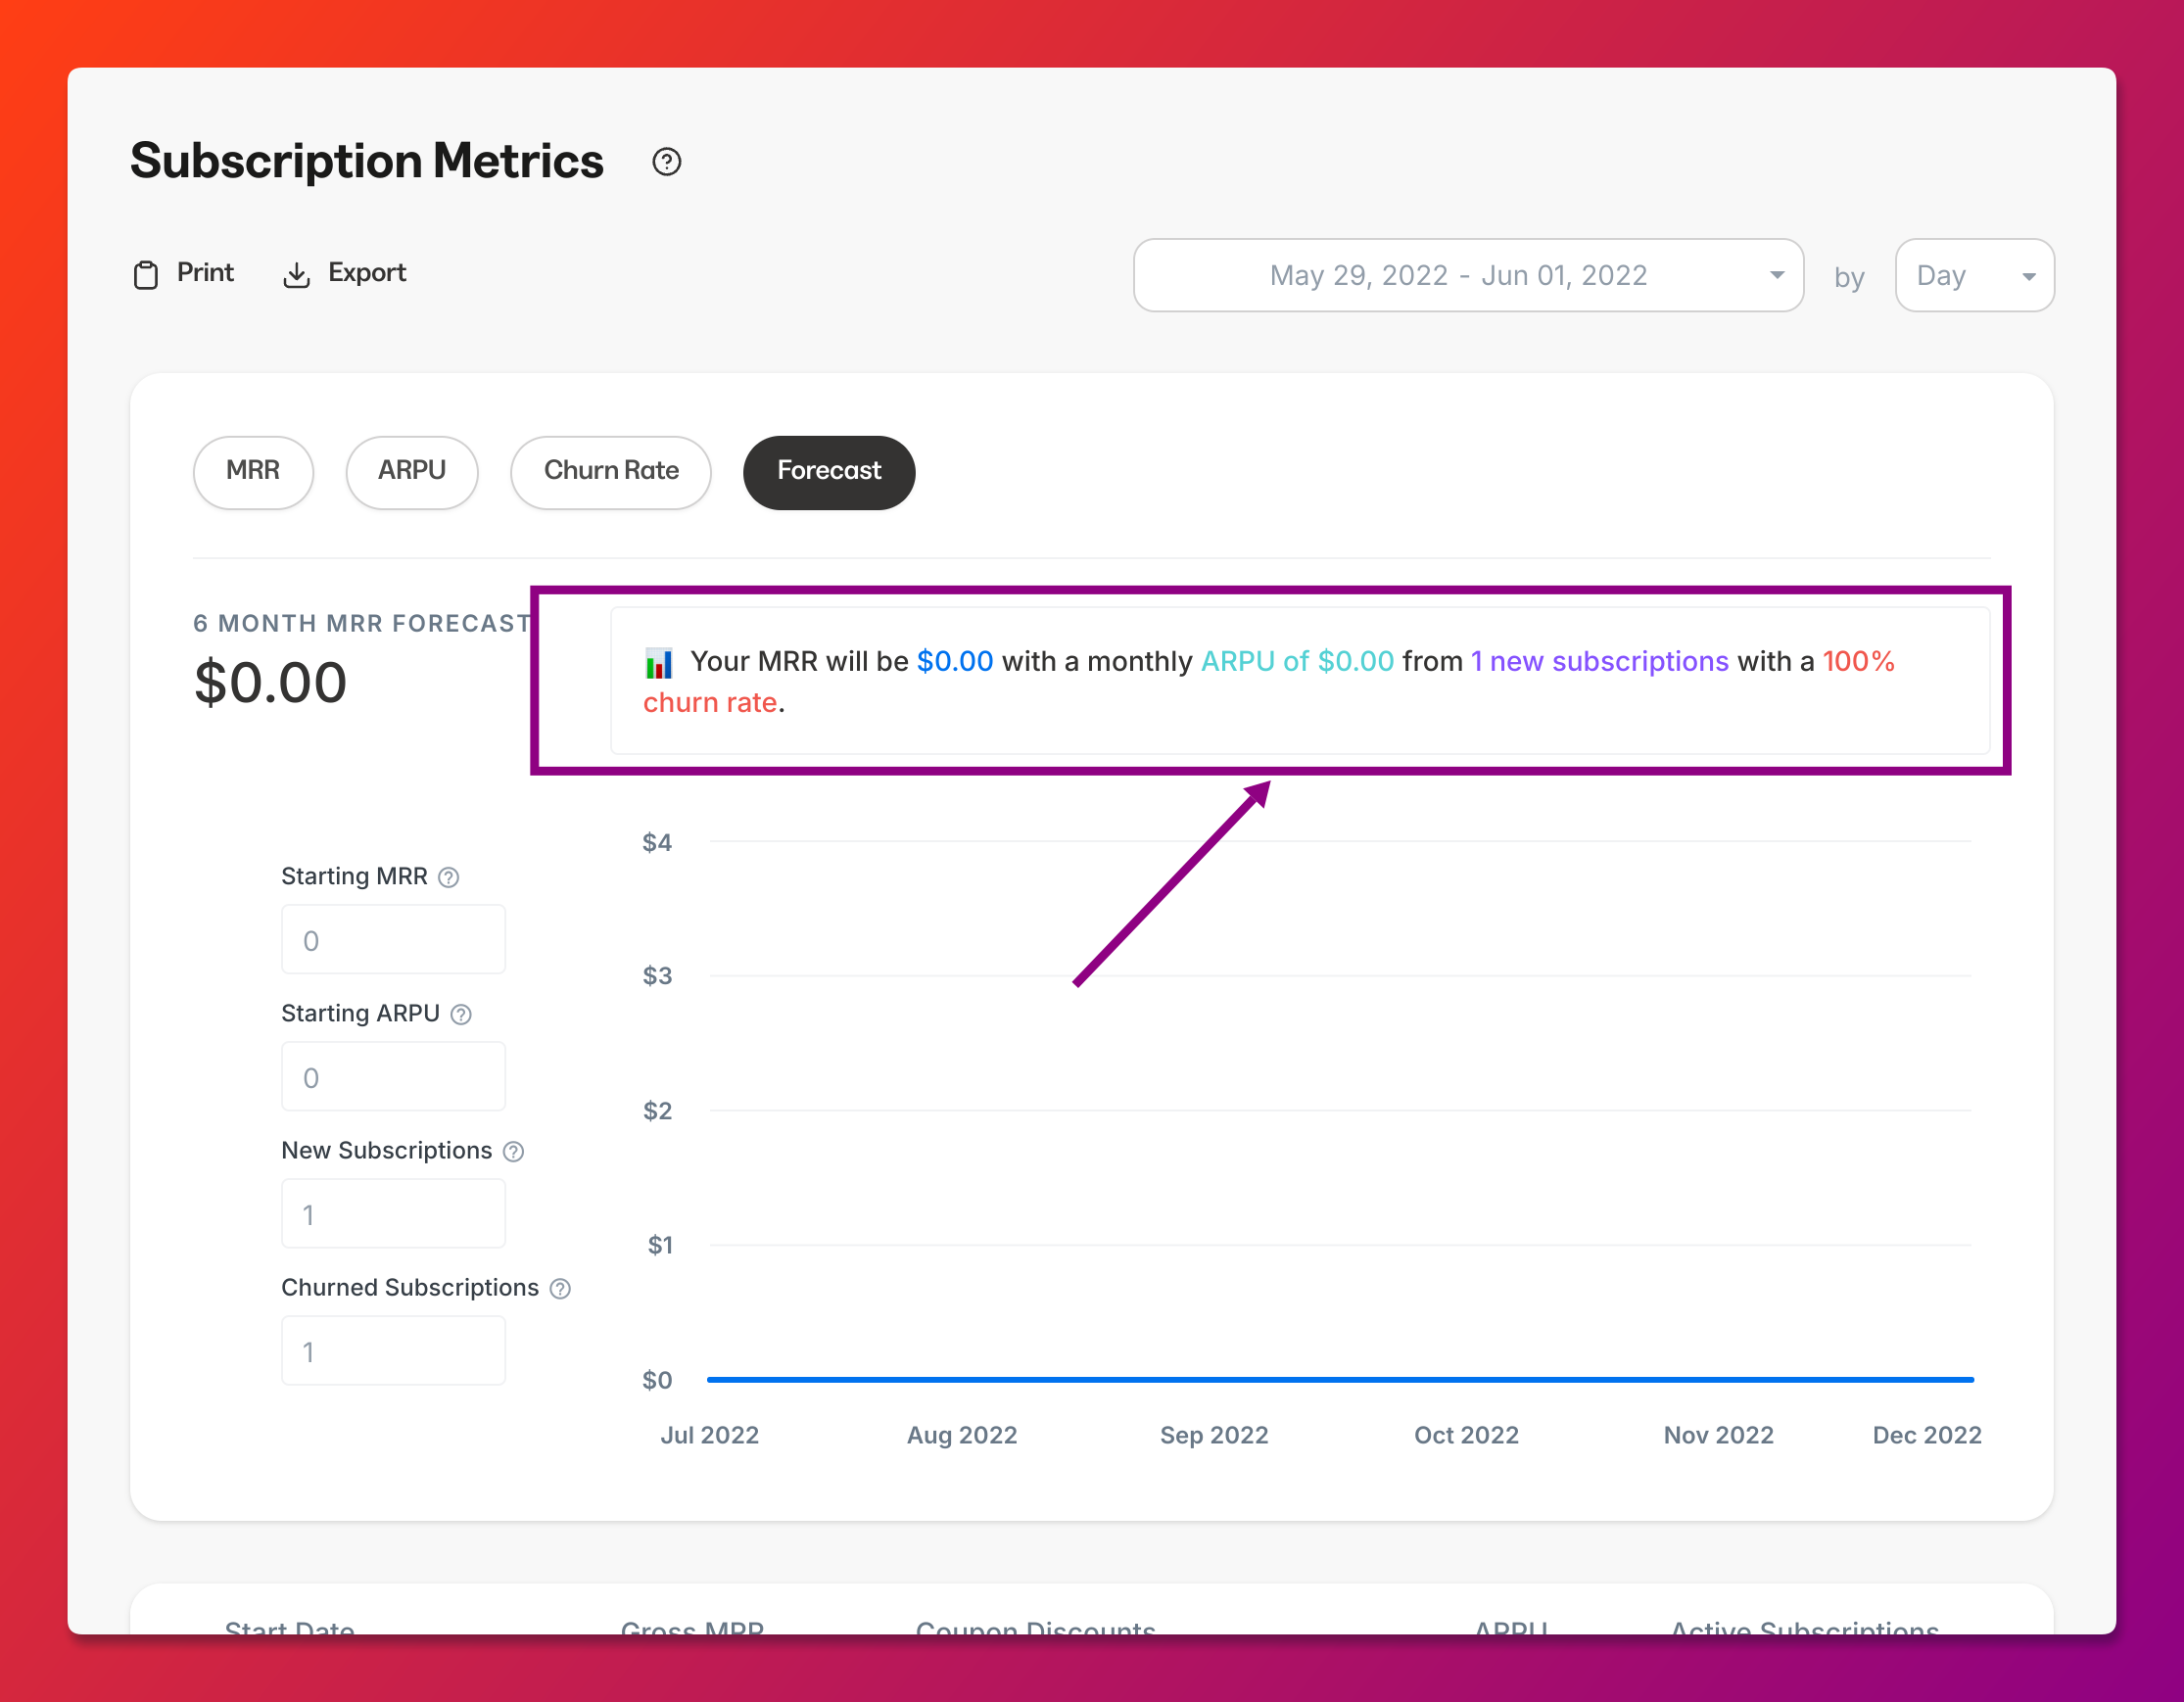
Forecast
What is the Forecast tool?
The Forecast tool empowers you to predict and plan for the future of your business by projecting your MRR, ARPU, New Subscriptions, and Churn Rate over the next 6 months. Now you can set tangible, subscription-based goals according to your business needs all within Kajabi.
Starting MRR
The default value for your Starting MRR is your current MRR data from the last month. Enter a new Starting MRR to visualize the MRR you want in order to hit your goals in a 6-month time frame.
Starting ARPU
The default value for your Starting ARPU is your current ARPU data from the last month. Enter a new Starting ARPU to estimate the ARPU you need to reach your future income goals in a 6-month time frame.
New Subscriptions
This field represents the number of monthly new subscriptions. The default value is based on your current number of new subscriptions from the last month. Adjust this variable to strategize your monthly new subscription targets to meet your MRR goals in a 6-month time frame.
Churned Subscriptions
This field is the rate of churned or canceled subscriptions that are estimated each month of the Forecast. The default value is based on your current churn from the last month. Adjust your Churned Subscriptions value to strategize your 6-months and visualize how a change in your Churned Subscriptions can impact your growth trajectory.
Note:
The filters located on the right sidebar will not impact your Forecast tool projections. Additionally, Multiple Payment Offer Types are not included in the calculations when using the Forecast Tool as it is not a subscription, but rather a one-time payment spread out over a specified period of time.
How do I use the Forecast tool?
Adjust the MRR, ARPU, New Subscriptions, and Churned Subscriptions values and watch as your 6 Month MRR automatically adjusts to reflect your 6-month projection.
The Blue bar in your Forecast tool represents your custom MRR according to your custom values.
The Grey bar in your Forecast tool reflects your current MRR based on your last month.
Note:
Capture your 6-month projection by setting your MRR date range to the current month before clicking the Forecast tab.
Keep an eye on your Dynamic Forecast Statement as well! Your Dynamic Forecast Statement located above the graph will change according to your custom values.
Tip:
Hover over your graph to see your projected monthly MRR over the course of the 6-month projection based on your current and custom values.
What do I do with these projections?
Use your Forecast tool to clarify your goals and identify your action plans to achieve those goals.
Note:
Exporting your Subscription Metrics Report will notify the owner of the Kajabi account if the owner has selected to receive notifications data is exported from their account. Learn to update email notification settings.
Exported Data
The following data is exported with the Subscription Metrics report:
Start Date
Monthly Recurring Revenue
Monthly Discounts
Average Revenue Per User
Active Subscriptions
New Subscriptions
Churned Subscriptions
Churn Rate
Still have questions? Let us know your question below to have it added to the list or reach out to Support if you need additional assistance. Thanks for being the best part of Kajabi!