

- Tracking how many abandoned checkouts are being recovered through email follow-ups
- Monitoring email engagement (opens, clicks) for your abandoned checkout emails
- Understanding the revenue impact of your abandoned checkout email settings
Data Presented in this Report
Data table
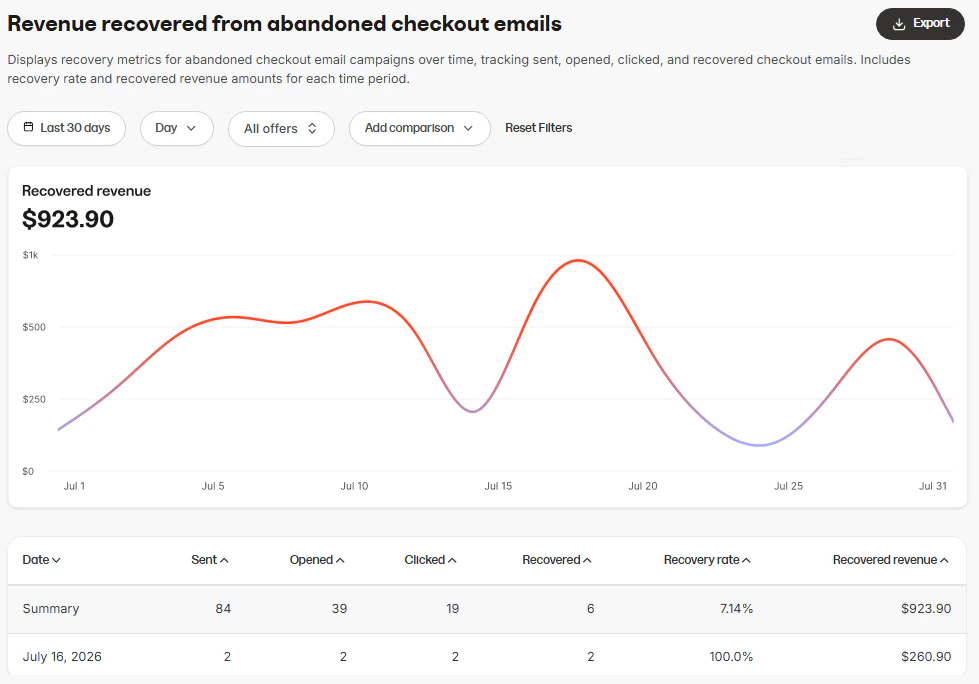
The data table includes the following columns:- Date: The time period for the row of data, based on your selected granularity (day, week, or month).
- Sent: The total number of abandoned checkout emails sent during the period.
- Opened: The number of sent emails that were opened by the recipient.
- Clicked: The number of sent emails where the recipient clicked a link.
- Recovered: The number of checkouts that were completed after the recipient received an abandoned checkout email.
- Recovery Rate: The percentage of sent emails that resulted in a completed purchase (Recovered ÷ Sent × 100).
- Revenue Recovered: The total revenue attributed to recovered checkouts during the period.
How to use this report
You can customize the data displayed in the report using several controls.- Time range: Filter results by time period (e.g., last 30 days, custom date range).
- Interval: View data broken down by day, week, or month.
- Offer selection: Filter results to a specific offer or view data across all offers.
- Add comparison: Compare performance across two time periods side by side.
Export information
When you export the Revenue Recovered from Abandoned Checkout Emails report, the resulting file will include the same columns and reflect any filters you have applied. This ensures the data in the export matches what is displayed in the report:- Date
- Sent
- Opened
- Clicked
- Recovered
- Recovery Rate
- Revenue Recovered
- Currency